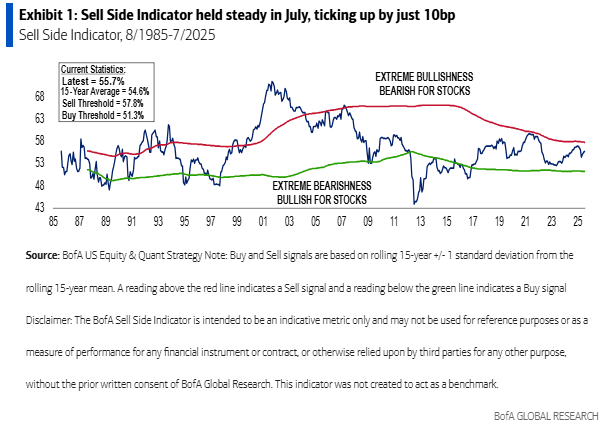
US Bank SSI Indicator Nears "Sell" Signal with 2.1% Space - Market Optimism May Diverge from Fundamental Support
Our sources at Zhitong Caicheng App have learned that Wall Street strategists are generally maintaining their stock configurations unchanged, but the SSI indicator (measuring the average recommended stock exposure level by sell-side analysts) is rapidly approaching the critical point for a "sell" signal, hinting that market optimism may be diverging from fundamental support.
According to a report released by Savita Subramanian, Head of US Equity and Quantitative Strategy at UBS, on August 1st, the SSI indicator only rose 10 basis points to 55.7% in July, still within the "neutral" zone, but just 2.1 percentage points away from triggering a "sell" signal, whereas it is 4.5 percentage points away from reaching a "buy" signal.

At the time of this data release, the S&P 500 index achieved a 2% gain last month, with strategists generally maintaining their original stance in the midst of optimistic second-quarter earnings and high valuations, as well as near-term tariff deadlines.
Subramanian emphasized, "The SSI has always been a reliable contrarian indicator - when Wall Street is bearish, markets tend to rise; conversely, when they're bullish, one should be cautious of risks."
The current 55.7% reading of the SSI indicator may not yet reach extreme levels but is approaching historical highs seen in 2000 (59%), 2007 (64%), and 2022 (59%). The UBS model shows that this level corresponds to a 12% expected return for the S&P 500 index over the next 12 months, serving as one of the key factors for building broader market outlook.
Notably, multiple market indicators suggest speculative sentiment is warming up. The latest fund manager survey by UBS shows that meme stocks are reactivating, micro-cap stocks are performing strongly, and risk appetite metrics have set a new high, although cash allocation has decreased slightly, the overall stock overweight position remains below critical levels.
In this context, UBS continues to recommend large-cap value stocks as the core configuration direction. Subramanian noted, "We haven't seen widespread overoptimism yet, but some signals are starting to display speculative bubble characteristics."
As the market gradually approaches a state of overconfidence, holding a sufficient amount and attractive valuation large-cap value stocks with improved asset-liability ratios could become a potential safe haven during any future pullbacks, making them still the preferred hedging strategy for this institution.
